Concentration of capital: Dissecting the Forbes’ 2021 List of the Biggest 2000 Corporations
Concentration of capital: Dissecting the Forbes’ 2021 List of the Biggest 2000 Corporations
Information Bureau | Communist Party of the Philippines
June 2021
Download: PDF
Forbes Magazine is one of the leading magazines of the monopoly capitalist world. It recently released its latest (2021) list of the biggest 2000 corporations. It is instructive to study the list as it gives us a picture of the current state of the global capitalist system, who the biggest capitalists are, and most importantly, the extent to which capital is concentrated in the hands of a few monopolists.
The observations below are a reaffirmation of some of the basic characteristics of monopoly capitalism or imperialism as described by Lenin where capital has become highly concentrated in the hands of a few giant capitalists. As seen below, not only is capital concentrated in these biggest capitalists, it is concentrated even further in the hands of a few supermonopoly companies which hold the biggest portion of the total assets and employ the biggest number of workers.
We will also show how a large part of the total capital is in the financial sector indicating how banks and other relatively newer forms of financial companies rule in the current stage in capitalist development.
1. Concentration of wealth. The 2000 listed corporations have total assets worth US$223.39 trillion, which is equivalent to 55.90% of the global household wealth of US$399 trillion in 2020 (Credit Suisse). It is also nearly 240% bigger than the anticipated world GDP for 2021 of $93.890 trillion (IMF).
All in all, the listed biggest corporations are found in only 61 countries (or 31% of total number of countries). Up to 63.45% of the biggest corporations are concentrated in the biggest capitalist countries: the United States, China, Japan and the EU capitalist centers (the United Kingdom, Germany and France). Almost 30% of the corporations are owned by US capitalists.
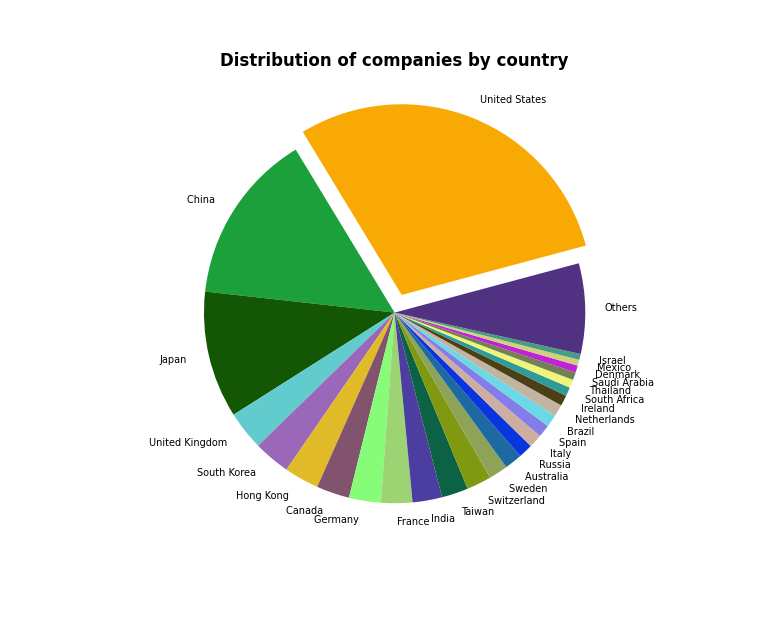
2. The number of the listed biggest corporations in the US is more than twice than that in China; or up to 40% if one adds the Hong Kong companies to China. However, the assets of Chinese (with Hongkong) corporations (US$ 50.240 trillion) are almost equal to that of the US companies (US$ 51.758 trillion). This indicates a higher level of concentration of capital in China.
3. A total of 91.87 million workers are employed in 1,865 companies in the Forbes 2000 list (employees data on 235 companies are not available). In comparison, the ILO estimates a global workforce of 3.49 billion (2019). It can, thus, be said that only 2.63% of the total workforce produces.
In the Forbes list of biggest companies, 33.19 million workers (or 36.12%) are employed in only 50 companies or 2.68%. In the oil industry, 38.51% of workers (1.3 million) are employed by only three companies out of the 83 listed companies which employs a total of 3.46 million workers. In the retail sector, a total of 9.28 million workers are employed in 70 companies, of which, 6.3 million (or 68.85%) are employed by only 10 companies (or 14.28%). In the consumer durables sector, 7.53 million are employed in 88 companies, of which, 2.82 million (37.4%) are employed by only 10 companies (or 11.36% of the total).Less than 1% (11 companies) of the listed companies employ more than 460,000 workers. Overall, they employ 8.27 million workers or 9% of the total.
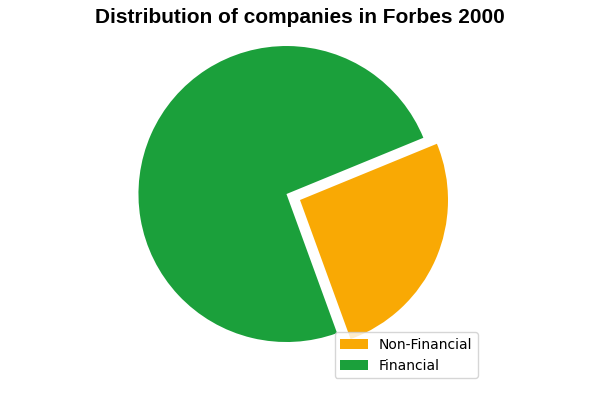
4. Dominance of finance capital. Overall, the top four industries in terms of assets are composed of corporations engaged in finance capital operations. These 621 corporations (31.05% of the total) include 289 banks, 132 corporations in diversified financials, 114 in insurance and 86 in business services and supplies. These finance corporations have assets amounting to US$ 156.40 trillion or 74.35% of the total assets of the listed corporations. Banks, alone, have assets amounting to US$ 107.502 trillion, or 48.12% of the total.
Of all the biggest banks, 44 are from China, 40 from Japan and 36 from the United States, comprising 41.52% of the total. The four biggest banks in terms of assets are from China: the Industrial & Commercial Bank of China (ICBC), China Construction Bank, Agricultural Bank of China and Bank of China.
As much as 55.30% of all companies in the diversified financials sector are from the US (54) and China (19). Although 28.07% of all insurance companies are from the US, the biggest ones are from Japan with assets amounting to 17.44% of the total assets in the sector. The Business Services and Supplies sector is dominated by the US with 44 companies controlling 84.53% of assets, with Japan a far second with 13 companies having 7% of total assets.
5. Rounding up the top ten biggest industries in terms of assets are Construction, Oil & Gas Operations, Consumer Durables, Utilities, Telecommunications Services, Drugs & Biotechnology.
(a) Almost half of the construction sector is dominated by 67 Chinese corporations (including those listed in Hong Kong) comprising 48.91% of the biggest construction and 74.98% of the total assets in construction. China is followed by Japan with 19 companies (6.74% of assets) and the US with 17 (3.36% of assets). There are 34 other construction corporations in the Forbes list distributed in 19 different countries.
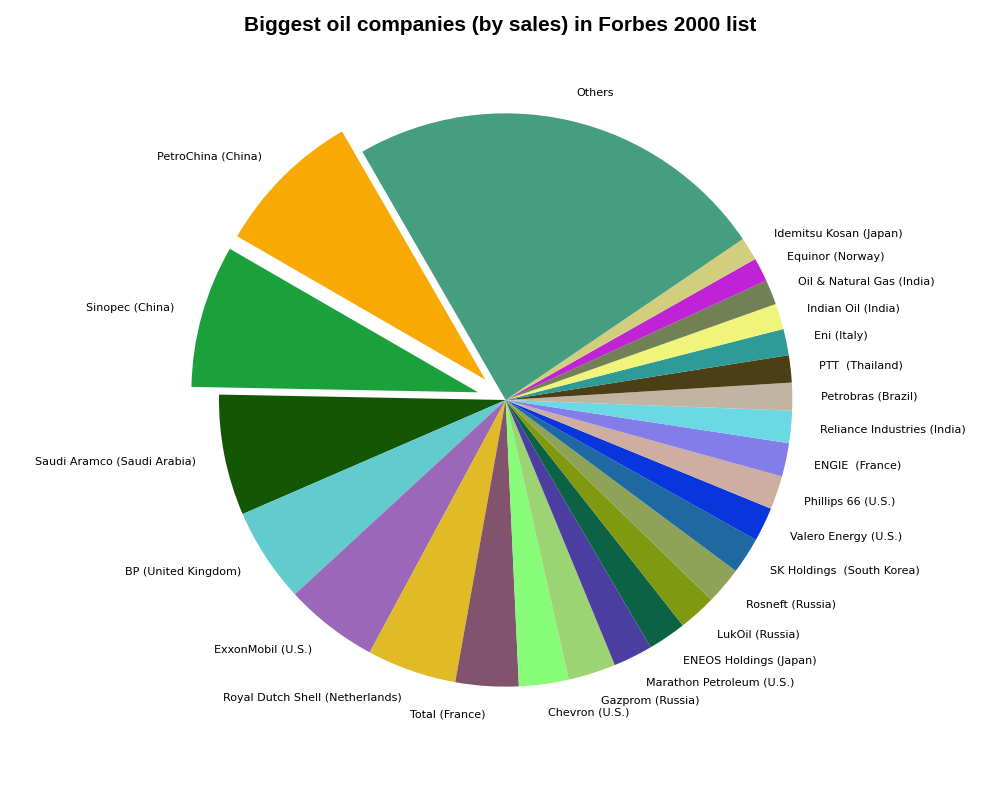
(b) There are 83 oil corporations listed in the Forbes 2000 with total assets of US$ 6.799 trillion, up to 65.89% of which is concentrated in the top 20 biggest corporations with assets of US$ 4.480 trillion. Of the top oil corporations, 21 are listed in the United States, 7 in Russia, 6 in Canada, 6 in Japan, 5 in India, 4 in China and 4 in South Korea.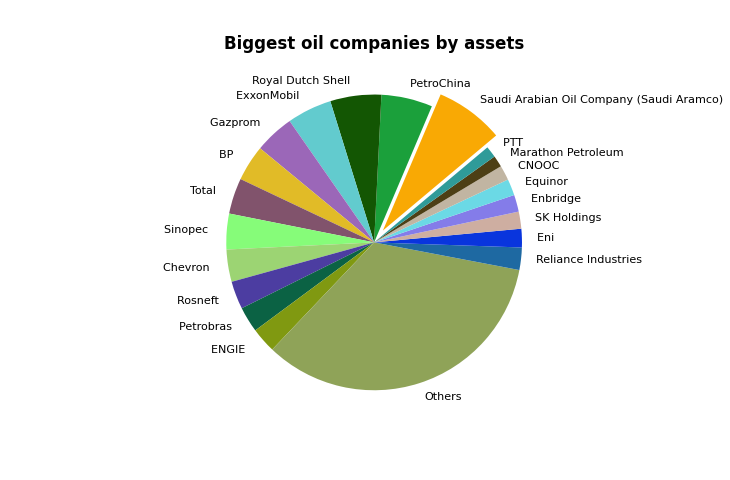 The biggest oil companies ranked by Forbes are Saudi Aramco, PetroChina, Royal Dutch Shell, ExxonMobil, Gazprom, BP, Total, Sinopec, Chevron and Rosneft. However, the two Chinese corporations rank first and second in terms of 2020 sales combining to control 16.3% of total oil products sales last year.
(c) As much as 73.25% Of the total assets in the Consumer Durables sector are controlled by companies in only three countries, namely, Japan, Germany and the United States. Rounding up the top ten are China, South Korea, France, Netherlands, Sweden, India and Switzerland. Companies in these countries control 97% of all assets in the sector.
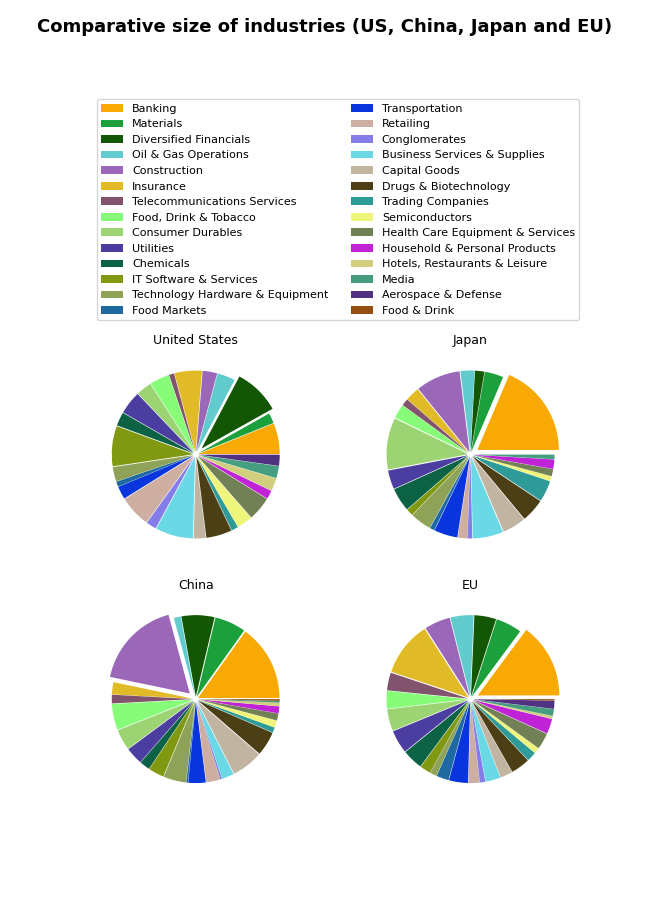
6. Biggest sectors in the capitalist centers.
(a) China. Companies in the construction sector dominate the Forbes’ list of biggest corporations in China (51 of 91 or 56.04%). But in terms of assets, Chinese banks and finance companies dominate with US$36.796 trillion or 79.62% of the total, followed by those in construction (9.4%) and Oil & Gas companies (1.45%).
(b) In the US, the biggest number of companies are in the Diversified Financials sector with 54 or 9.15% of US total listed companies, followed by IT Software & Services (47), Business Services & Supplies (44), Retailing (37), Banking (36), Insurance (32), Drugs & Biotechnology (30), Health Care Equipment & Services (28), Utilities (27) and Food, Drink & Tobacco (23). In terms of assets, US companies are dominated by those in financial operations with only 166 companies (28.1%) having almost 70% of total assets.
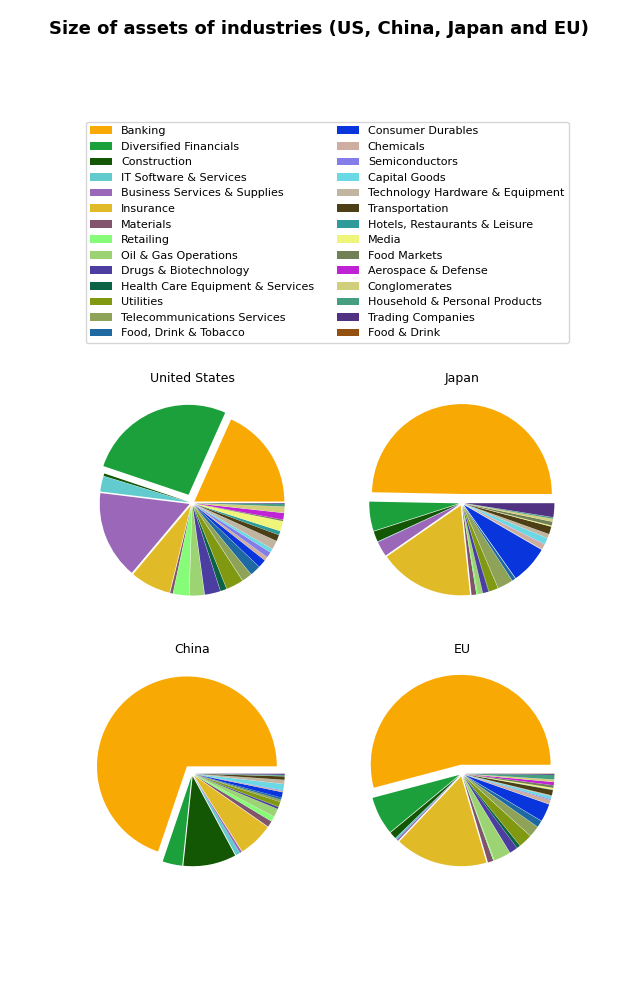
(c) In Japan, 63 banks and other financial companies or 29.30% of total listed corporation control 74.7% of the total assets. These are followed by companies in Consumer Durables, Telecommunications Services, Trading Companies, Construction, Utilities, Transportation, Capital Goods, Drugs & Biotechnology, Chemicals.
(d) In the EU (including the United Kingdom), 119 companies in the financial sector (or 29.67%) control as much as 77.61% of the total assets of EU listed corporations. These are followed by companies in Consumer Durables, Oil & Gas Operations, Utilities, Telecommunications Services, Drugs & Biotechnology, Construction, and Food, Drink & Tobacco.
We welcome comments and suggestions regarding this short study. Please write to us at [email protected].
Tables
| Country | Companies | Assets (US$ billion) |
|---|---|---|
| United States | 590 | 51,758.88 |
| China | 291 | 46,213.00 |
| Japan | 215 | 25,080.90 |
| United Kingdom | 66 | 13,614.20 |
| South Korea | 62 | 5,447.30 |
| Hong Kong | 59 | 4,027.10 |
| Canada | 56 | 8,257.70 |
| Germany | 54 | 7,906.50 |
| France | 53 | 12,181.50 |
| India | 50 | 3,355.00 |
| Industry | Assets |
|---|---|
| Banking | 107,502.80 |
| Insurance | 24,455.81 |
| Diversified Financials | 24,448.03 |
| Business Services & Supplies | 9,688.90 |
| Construction | 7,009.80 |
| Oil & Gas Operations | 6,799.80 |
| Consumer Durables | 5,280.20 |
| Utilities | 4,668.80 |
| Telecommunications Services | 3,968.08 |
| Drugs & Biotechnology | 2,838.50 |
| Trading Companies | 2,427.90 |
| Materials | 2,402.60 |
| Food, Drink & Tobacco | 2,382.60 |
| Retailing | 2,246.70 |
| IT Software & Services | 2,197.00 |
| Technology Hardware & Equipment | 2,123.80 |
| Transportation | 2,013.90 |
| Capital Goods | 1,596.60 |
| Chemicals | 1,592.10 |
| Conglomerates | 1,545.60 |
| Media | 1,191.70 |
| Health Care Equipment & Services | 995.10 |
| Aerospace & Defense | 938.50 |
| Household & Personal Products | 889.20 |
| Semiconductors | 880.60 |
| Food Markets | 811.10 |
| Hotels, Restaurants & Leisure | 462.20 |
| Food & Drink | 29.80 |
| Name | Country | Assets |
|---|---|---|
| ICBC | China | 4,914.70 |
| China Construction Bank | China | 4,301.70 |
| Agricultural Bank of China | China | 4,159.90 |
| Bank of China | China | 3,731.40 |
| Mitsubishi UFJ Financial | Japan | 3,406.50 |
| BNP Paribas | France | 3,044.80 |
| HSBC Holdings | United Kingdom | 2,984.20 |
| Bank of America | United States | 2,832.20 |
| Credit Agricole | France | 2,399.50 |
| Sumitomo Mitsui Financial | Japan | 2,256.80 |
| Name | Country | Assets |
|---|---|---|
| JPMorgan Chase | United States | 3,689.30 |
| Citigroup | United States | 2,314.30 |
| Goldman Sachs Group | United States | 1,302.00 |
| London Stock Exchange | United Kingdom | 1,160.70 |
| Morgan Stanley | United States | 1,158.80 |
| ING Group | Netherlands | 1,146.80 |
| Prudential Financial | United States | 940.70 |
| Berkshire Hathaway | United States | 873.70 |
| Natixis | France | 606.00 |
| Japan Exchange Group | Japan | 575.30 |
| Name | Country | Assets |
|---|---|---|
| Saudi Aramco | Saudi Arabia | 510.30 |
| PetroChina | China | 380.50 |
| Royal Dutch Shell | Netherlands | 379.30 |
| ExxonMobil | United States | 332.80 |
| Gazprom | Russia | 294.90 |
| BP | United Kingdom | 267.70 |
| Total | France | 266.10 |
| Sinopec | China | 265.10 |
| Chevron | United States | 239.80 |
| Rosneft | Russia | 207.50 |
| Name | Country | Industry | Employees |
|---|---|---|---|
| Walmart | United States | Retailing | 2,300,000.00 |
| Amazon | United States | Retailing | 1,298,000.00 |
| Volkswagen Group | Germany | Consumer Durables | 662,575.00 |
| Deutsche Post | Germany | Transportation | 571,974.00 |
| United Parcel Service | United States | Transportation | 543,000.00 |
| Accenture | Ireland | IT Software & Services | 506,000.00 |
| Home Depot | United States | Retailing | 504,800.00 |
| PetroChina | China | Oil & Gas Operations | 476,223.00 |
| Gazprom | Russia | Oil & Gas Operations | 473,800.00 |
| Tata Consultancy Services | India | IT Software & Services | 469,261.00 |